
The Impact of GDP on Housing Prices: Insights for 2025
While GDP isn’t a perfect predictor of housing prices, the two tend to run in the same direction. If we do in fact see a decline in GDP from 2024, it would take a unique set of circumstances to see anything more than flat housing prices in 2025.
Introduction
The best investors challenge commonly-held assumptions, even those that feel obvious and go unchecked. That’s been the driving force for our trifecta of articles on three of the major factors that affect housing prices: interest rates, population growth and the strength of the economy (GDP growth).
In June 2024, we wrote about the effect of interest rates on housing prices. There we looked at historical data and noted that periods of falling interest rates have historically seen slower than average housing price appreciation. However, the 3 years after rates stop falling have historically seen higher than average housing price appreciation.
In November 2024, we wrote about the effect that population growth has on housing prices. With the likelihood of seeing two years of low, or even negative population growth in Canada, there is a natural temptation to assume that prices will be weak over that period. However, the data shows that in the short-term at least, correlation between population growth and housing prices is quite weak, making population growth rates a poor predictor of housing prices in the short-term.
In this final article of 2024, we cover the connection between GDP growth and housing prices. We conclude with our thoughts on how these variables fit together, what other factors come into play, and what investors should expect from the Canadian housing market as we move into a new year.
GDP vs. Housing Price Growth
Unlike what we observed with both interest rates and population growth, intuition is accurate and there are fewer surprises in the data. There is a definite correlation between GDP growth and housing prices, as the two tend to run in the same direction, but housing prices generally see greater extremes than GDP growth.
Before we look at the data, a few notes on how it was derived:
- Annual GDP % (dashed yellow line) - Statistics Canada reports GDP in real terms, meaning that the dataset is already adjusted for inflation.
- New Housing Price Index (solid red line) - The NHPI only includes new houses, meaning that resales aren’t included in the data. Statistics Canada reports the NHPI in nominal terms, meaning it isn’t adjusted for inflation. To make for a more accurate comparison to GDP rates, we adjusted the NHPI by converting it into real terms by subtracting the annual “All-items” CPI rate from the NHPI. NHPI data goes back to 1981.
- Canadian Real Estate Association Housing Price Index (solid blue line) - For our purposes, we used the aggregate composite, which includes all housing types, both new and previously owned. Similar to the NHPI, it is also a nominal index, so the same approach of subtracting CPI was used to convert the data into real terms. HPI data only goes back to 2005.
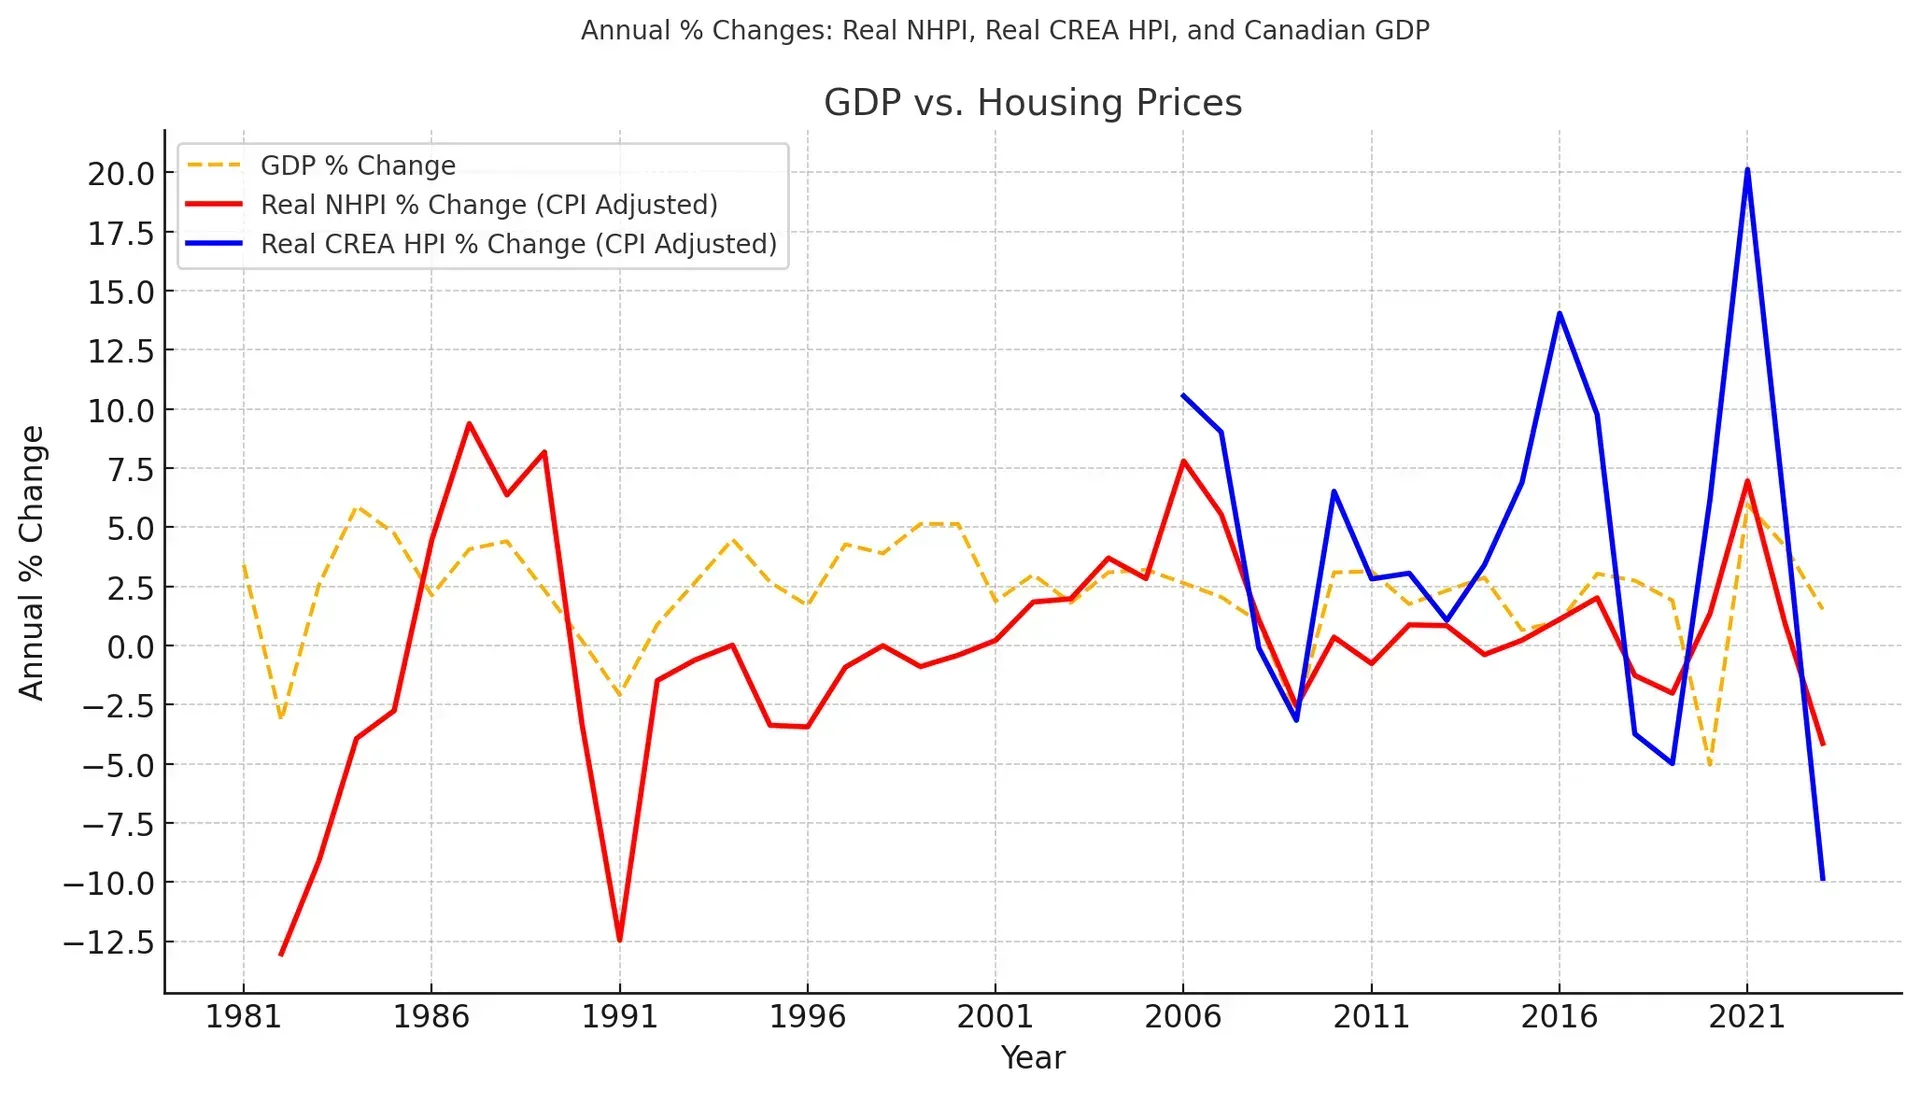
Chart created by Hawkeye Wealth, using the following data:
1. GDP - Statistics Canada. Table 36-10-0104-01 Gross domestic product, expenditure-based, Canada, quarterly
2. CPI - Statistics Canada. Table 18-10-0004-01 Consumer Price Index, monthly, not seasonally adjusted
3. NHPI - Statistics Canada. Table 18-10-0205-01 New housing price index, monthly
4. HPI - Canadian Real Estate Association - HPI Data
Observations
The direction of GDP rates has historically been an excellent predictor of the direction of housing prices, but on its own, it is less useful for explaining the size of the change in housing prices. Other factors, such as interest rates, population, housing supply and foreign investment all interact with the strength of the economy to create swings in housing prices that tend to be more volatile than what GDP exhibits.
Though the sample size is small, since 2005, new homes have been more tightly correlated with GDP and seen less volatility than previously owned homes.
The correlation between new housing and GDP has been especially strong since 1991, when Canada first introduced the inflation control target of 2%. Prior to 1991, interest rates were more important for explaining and predicting housing prices.
In the early 1980s, housing prices were declining more sharply than the overall economy. GDP bottomed at -2.5% in 1981, but new home prices fell by -12.5% that year. This gap is largely explained by interest rates, which peaked at over 20% in 1981 in an attempt to reign in inflation. These historically high interest rates had a disproportionate cooling effect on housing prices.
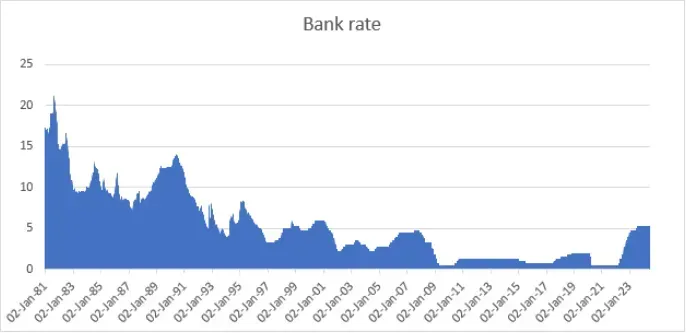
Source: Statistics Canada. Table 10-10-0145-01 Financial market statistics, Bank of Canada
A similar story played out from 1988 to 1991, as another period of stagflation (low GDP, high inflation and unemployment) prompted increases in the bank rate up to ~14%, sinking the market for new homes.
Once interest rates stabilized throughout the 1990s and into the 2000s, housing price growth began to align much more closely with GDP growth rates.
Periods of modern divergence
2005 - 2007: Since 1981, there have been very few years where new homes appreciated despite a declining GDP, but the period between 2005 - 2007 is the most notable example. The major difference in this period was the boom of credit availability combined with low interest rates, which fueled price growth independent of GDP.
2014 - 2017: Interestingly, this boom wasn’t felt for new housing, but the existing stock saw significant appreciation. Elected officials have often claimed that this housing boom was largely explained by foreign investment, which led to the introduction of foreign buyer taxes in BC in 2016 and Ontario in 2017. In reality, there is very little data on foreign investment from that period, and the data there is, such as the CMHC’s survey of Foreign Ownership of Condos in Canada, shows that only 3.3% of condos in Toronto and 3.5% in Vancouver were foreign owned. This surge is likely explained by supply/demand imbalance caused by a mix of speculation and increasing migration to urban centres, with minimal new supply to absorb it.
Despite these periods of divergence, GDP has historically been a primary determinant of the direction of housing prices, with many other factors combining to determine the strength of the overall housing market.
Looking out at Canada's GDP in 2025
Our best guess is that GDP will slow in 2025 but not fall into recession territory, though there is some reason to believe that GDP could take a larger hit. Much has been made about the fact that while Canada isn’t in a technical recession, GDP per capita has declined for six consecutive quarters (Morningstar). If this trend continues, Canada is almost guaranteed to see a negative GDP in 2025, seeing as we are projecting population declines for the first time in Canadian history.
To balance this, lower interest rates and the associated lower cost of borrowing should serve to spur investment in both industry and housing and offset the slowing economy to at least some extent.
The wildcard from a GDP perspective is whether tariffs from the U.S. will materialize, the proposed rates, and the industries targeted. While any tariffs would likely have a negative impact on Canadian GDP, the scope and extent will depend on what is implemented.
While GDP isn’t a perfect predictor of housing prices, it does tend to get the direction right. If we do in fact see a decline in GDP from 2024, it would take a unique set of circumstances to see anything more than flat housing prices in 2025.
Conclusion - Putting it all together
For whatever reason, it’s an incredibly popular belief in investment circles that periods of low interest rates lead to strong housing price appreciation (Dec 12, 2024 - BNN Article). In fact, Alana Riley, head of mortgage insurance and banking at IG Wealth Management said just last week that, “Historically, periods of declining interest rates have led to increased property values in larger urban markets across Canada”.
Our reading of data found exactly the opposite. Historically, periods of falling interest rates have seen below average housing price appreciation, as falling interest rates have typically been a sign of a weak economy and slow demand. The weakness of the economy typically overshadows the effect of declining interest rates. However, it is true that once rates stop falling and the economy stabilizes, markets experience above average rates of housing appreciation.
As interest rates are expected to continue to come down in 2025 to head off potential recession, history says that on average, we should expect below average rates of housing price appreciation.
On the population side, if the projected negative population growth rates in 2025 and 2026 materialize, the market will have two years to add supply without seeing any significant new demand, which doesn’t support price strength.
Combining all of these factors together, there is little reason to believe that lower interest rates alone will be sufficient to buoy up the housing market in the face of declining GDP and low demand for housing.
As we enter the holiday season, this slower market environment also represents a time for reflection and preparation. While the outlook for 2025 is murky, history reminds us that challenges can create opportunities for those prepared to act decisively. We also believe it could be a great year to keep an eye out for real estate opportunities south of the border.
Here’s to a prosperous and thoughtful year ahead! Happy holidays from our team at Hawkeye Wealth and we look forward to working with you in 2025.